

Imagine being targeted with an advertisement for this blog. You’d like to know: why did the AI model predict you’d be interested in the Faculty of Business and Economics’ blog, based on the hundreds of web pages you visited? The answer could be: because you visited www.great-business-faculties.com, www.datascience-in-business.org and www.living-in-antwerp.com: if you would not have visited these pages, you’d no longer be targeted with this specific ad. This explanation is an example of an imaginary “Evidence Counterfactual”.
The use of such browsing data, as well as Facebook likes or location data is often used in targeted advertising systems, and beyond. The predictive models are increasingly complex, while end users become more vocal in their wish for transparent and explainable systems.
When being the subject of such predictive models, businesses and citizens might ask: why I am being rejected credit? Why I am being targeted with this ad? Etc. The European GDPR even provides the “right to obtain meaningful information about the logic involved” to data subjects who are involved in automated decision making.
In this post, you’ll learn more about the Evidence Counterfactual, an increasingly important approach within the “explainable AI” research domain, that helps understand the decisions of predictive systems that use Big Data. The Applied Data Mining research group has developed algorithms to provide such explanations, and validated them in a variety of business domains.
Behavioral big data
More and more companies are tapping into a large pool of humanly-generated data, or “behavioral big data”. Think of a person liking Instagram posts, visiting different locations captured by their mobile GPS, searching Google, making online payments, connecting to people on LinkedIn, and so on. All these behavioral traces lead to artificial intelligent (AI) systems with very high predictive performance in a variety of application areas, ranging from finance to risk to marketing1 .
The goal of these AI systems is to use this data to predict a variable of interest, for example, a person’s personality traits, product interests, creditworthiness and so on. The model uses a large number of small pieces of evidence to make predictions. Let’s refer to all that data as the “evidence pool“. The pieces of evidence are either “present” or “missing”. All pieces that are present can be used to make predictions.2
Tourist or citizen?
To illustrate how behavioral big data can be seen as a “pool of evidence,” imagine a model that uses location data of people in New York City to predict if someone is a tourist or a citizen. Out of all possible places to go to (the “evidence pool”), a person will only visit a relatively small number of places each month.
These are the pieces of evidence that are “present” and are represented by a value of 1 (see Figure 1). All places that are not visited by that person are “missing” and get a corresponding zero value in the data matrix.
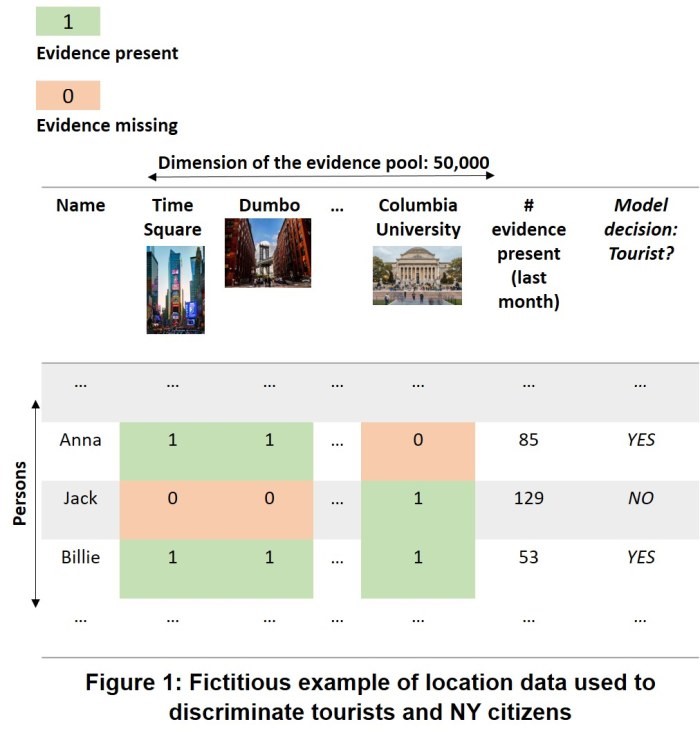
In Figure 1, for example, Anna visited 85 places out of the 50,000 possible places used by the model. She visited Times Square and Dumbo, but she did not visit Columbia University, making this a missing piece of evidence. The model decides she’s a tourist.
Intuition behind the Evidence Counterfactual
Explaining how predictive systems make decisions based on big data is challenging. Evidence Counterfactuals helps understand the reasons behind individual model predictions. This explanation approach3 identifies a causal relationship between two events: event A causes event B, only if we observe a difference in B after changing A, while keeping everything else constant.4
The Evidence Counterfactual shows a subset of evidence (event A) that causally drives the model’s decision (event B). We imagine two worlds, identical in every way up until the point where the evidence set is present in one world, but not in the other. The first world is the “factual” world, the unobserved world is the “counterfactual” world. To help clarify this, consider the following:
IF Anna did not visit Times Square and Dumbo, THEN the model’s prediction changes from tourist to NY citizen.
The pieces of evidence {Times Square, Dumbo} are a subset of the evidence of Anna (all the places she visited) and explain the model’s decision. Simply removing Times Square or Dumbo from her visited locations would not change the predicted class. Both locations need to be “removed” (feature value set to zero) to change the model’s decision.
The “factual world” is the one that’s observed and includes all the places Anna visited. The “counterfactual world” that results in a predicted class change is identical to the factual world in every way up until the two locations Times Square and Dumbo.
An important advantage of counterfactuals is that they do not require all features that are used in the model (the “evidence pool”) or all the evidence (e.g., all places Anna visited) to be part of the explanation. This is especially interesting in the context of humanly-generated big data: it allows us to explain predictions using concise and comprehensible explanations.
Computing Evidence Counterfactuals
The huge dimensionality of the behavioral data makes it infeasible to compute counterfactual explanations using a complete search algorithm (this search strategy would check all subsets of evidence as candidate explanations).
Alternatively, a heuristic search algorithm can be used to efficiently find counterfactuals. One existing approach is based on a best-first search and makes use of the model’s scoring function to first consider subsets of evidence that, when removed, reduce the predicted score the most in the direction of the opposite predicted class.
There are at least two weaknesses of this strategy:

1) for some nonlinear models, removing one feature does not result in a predicted score change, which results in the search algorithm picking a random feature to expand in the first iteration;
2) the search time is very sensitive to the size of the counterfactual explanation: the more evidence that needs to be removed, the longer it takes the algorithm to find the explanation.
As an alternative to the best-first search, we proposed a search strategy that chooses features according to their overall importance for the predicted score.5 The idea is that the more accurate the importance rankings are, the more likely it is to find a counterfactual explanation starting from removing the top-ranked feature up until a counterfactual explanation is found. The hybrid algorithm LIME-Counterfactual (LIME-C) seems a favorable alternative to the best-first search because of its good overall effectiveness and efficiency.
Other data and models
Evidence Counterfactuals can address various data types, from textual data and tabular data (e.g. standard Excel files) to image data. The issue is to define what it means for evidence to be “present” or “missing.” To compute counterfactuals, we need to define the notion of “removing evidence” or setting evidence to “missing.” In this post, we focused on behavioral big data. For these data, which is very sparse (a lot of zero values in the data matrix), it makes sense to represent evidence that’s “present” by those features (e.g., word or behavior) having a nonzero value.
Key takeaways
- Predictive systems that are trained from humanly-generated Big Data have high predictive performance, however, explaining them is challenging.
- Explaining data-driven decisions is important for a variety of reasons (increase trust and acceptance, improve models, gain insights, etc.), and for many stakeholders (data scientists, managers, decision subjects, etc.).
- The Evidence Counterfactual is an explanation approach that can be applied across many relevant applications and highlights a key subset of evidence that led to a particular model decision.
By Yanou Ramon and Prof. David Martens, Applied Data Mining Research Group, University of Antwerp.
- Junqué de Fortuny, E., Martens, D., Provost, F., Predictive Modeling with Big Data: Is Bigger Really Better?, Big Data, 1(4), pp215-226, 2013
- Provost, F., Understanding decisions driven by big data: from analytics management to privacy-friendly cloaking devices, Keynote Lecture, Strate Europe, https://learning.oreilly.com/library/view/stratahadoop/9781491917381/video203329.html (2014)
- Martens, D., Provost, F., Explaining data-driven document classifications, MIS Quarterly, 38(1), pp73-99 (2014)
- https://causalinference.gitlab.io/causal-reasoning-book-chapter1/
- Ramon, Y., Martens, D., Provost, F., Evgeniou, T., Counterfactual Explanation Algorithms for Behavioral and Textual Data, arXiv:1912.01819 (2019). Available online