

Introduction
Recently, the conflict in Gaza has dominated headlines across mass media platforms. Preceding this, news of the war in Ukraine inundated the informational landscape, displacing the focus from the then-ongoing challenges posed by the Covid-19 pandemic. However, amidst these immediate crises, the growing threat of a massive debt crisis has been emerging. Private and public debt has increased massively in the last four decades and most countries around the globe are now confronted with high levels of debt. However, it is developing countries that are more at risk should a financial crisis hit, and many of these nations are already in turmoil. The fact that so little attention is being paid to this crisis has led experts to call it “the silent debt crisis” (Fleming & McDougall, 2023, November 7). If what we are currently observing escalates into a crisis like that of the 1980s, the repercussions will be dire. Millions of people will be pushed into absolute poverty and any prospect for a better future will vanish. At the same time, such an event will halt attempts to facilitate the adoption of climate change resilience solutions. We decided to investigate this subject by presenting the evolution and current situation of public debt globally, after which we focus on developing countries’ debt by comparing the current crisis with the one at the beginning of the 1980s. Finally, we discuss the causes of the issue and proposed solutions to tackle it.
A short overview of global debt
Over recent decades, public debt worldwide has escalated significantly. Specifically, global public debt has tripled since the mid-1970s (see Figure 1). Similarly, private debt has also tripled, growing to 146% of GDP (or approximately $144 trillion) over a more extended period spanning from 1960 to 2022 (IMF, 2023).
Figure 1: The trend of global debt and the pandemic blip
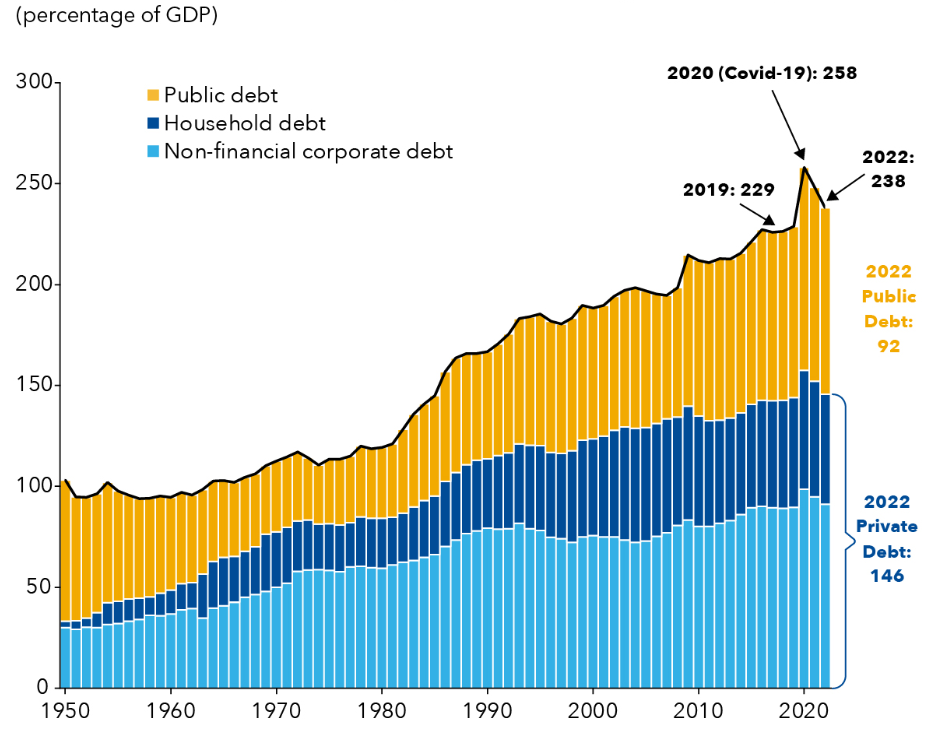
Source: Gaspar et al. (September 13, 2023)
China has emerged as a major player behind this surge in global debt, with borrowing outpacing economic growth. As a result, debt as a percentage of GDP in China has climbed to a level nearly equivalent to that of the United States (see Figure 2). However, despite this parallel, China’s debt figures remain significantly lower than those of the United States, standing at $47.5 trillion compared to the USA’s $70 trillion (Gaspar et al., September 13, 2023). In terms of non-financial corporate debt, China commands the largest share globally, accounting for 28% of the total (Gaspar et al., September 13, 2023). This underscores China’s significant influence on the global debt landscape.
Figure 2: Global Public and Private debt evolution
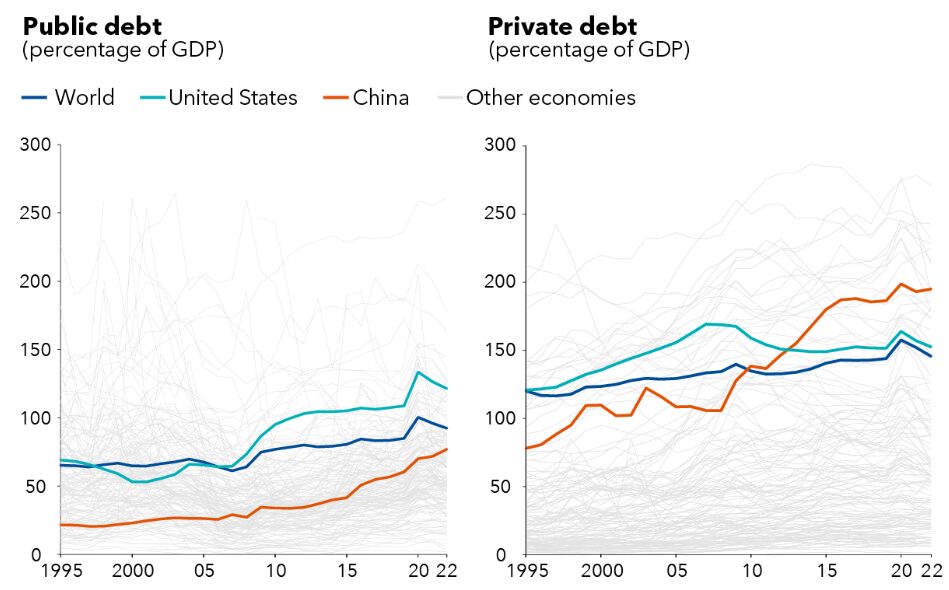
Source: Gaspar et al. (September 13, 2023)
The recent surge in global debt attributed to the pandemic, the conflict in Ukraine, and spikes in energy and food prices is deemed a temporary blip in the ongoing upward trajectory of debt levels, as per IMF experts’ assessment (Gaspar et al., September 13, 2023). By 2022, total global debt reached 238% of GDP, a 9-percentage-point increase from 2019. Amounting to $235 trillion, this figure surpassed the previous year by $200 billion (IMF, n.d.a). Despite economic growth since 2020 and high inflation rates, public debt remains persistently high, reaching $307 trillion in the second quarter of 2023 (IMF, n.d.a). However, public debt only decreased by 8 percentage points of GDP over the past two years, still far from pre-pandemic levels, while private debt saw a quicker decline of 12 percentage points of GDP (IMF, 2023). Notably, 80% of the 2023 debt increase originated from developed economies, with concerns primarily focused on mounting debt in Italy and the UK (Campos, 2023, September 19; Partington, 2022, October 20; Rossi & Consiglio, 2013, October 2). While advanced economies with high debts may be able to manage payments, challenges such as aging populations, climate change, and geopolitical risks—such as the wars in Ukraine and the Middle East—could complicate their financial stability (Bahceli et al., September 16, 2023). Conversely, many low- and middle-income countries (LMICs) face a higher risk of default, warranting further examination in the subsequent sections.
The “slow burn” of developing countries
The external debt stock of LMICs, in fact, decreased by 3.4 % in the period 2021 to 2022, from US$9.3 trillion to US$9.0 trillion. This decrease marked the first deviation from the upward debt trajectory that has characterized this group of countries since 2015. The main contributor to the 2022 decline was China, which accounted for around 26% of external debt stock of LMICs. As mentioned above, China occupies a very specific place in the current debt architecture. When China is excluded, the LMICs debt stock remained unchanged during this period, reaching $6.6 trillion (World Bank Group [WB], 2023). This overall stagnation masks a wide divergence in external debt stock trends at the country level, ranging from a 7% increase for Colombia to a 20.3% decline for the Russian Federation (WB, 2023).
At the same time, in the last decade public debt has increased at a faster rate in developing countries compared to developed countries, though the starting point of their total debt was much lower (see figure 4). The proportion of LMIC countries in debt distress (with public debt higher than 60% of GDP) increased sharply from the lowest number of 22 countries in 2011 to 70 in 2023 (United Nations Conference on Trade and Development [UNCTAD], July, 2023; IMF, November 30, 2023) (see Figure 3). Four of the world’s Lowest Income Countries (LICs) are set to spend a total of $21.5bn on financing their external public debt across 2023 and 2024, representing a rise of almost 40% compared to the previous two years (McDougall, December 13, 2023).
Figure 3: Rise in public debt
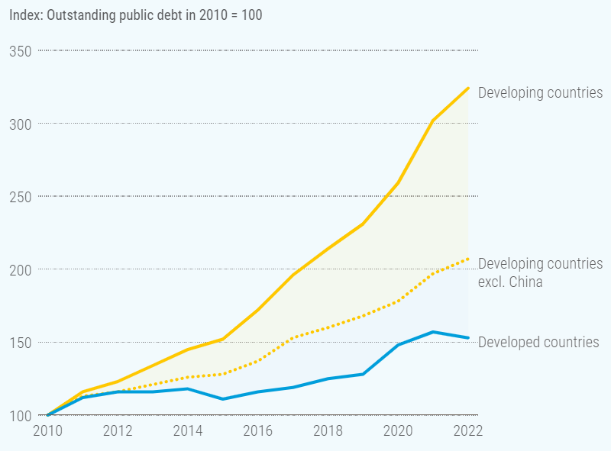
Index: Outstanding public debt in 2010 = 100
Source: UNCTAD (July, 2023)
Figure 4: Number of developing countries with public debt exceeding 60%
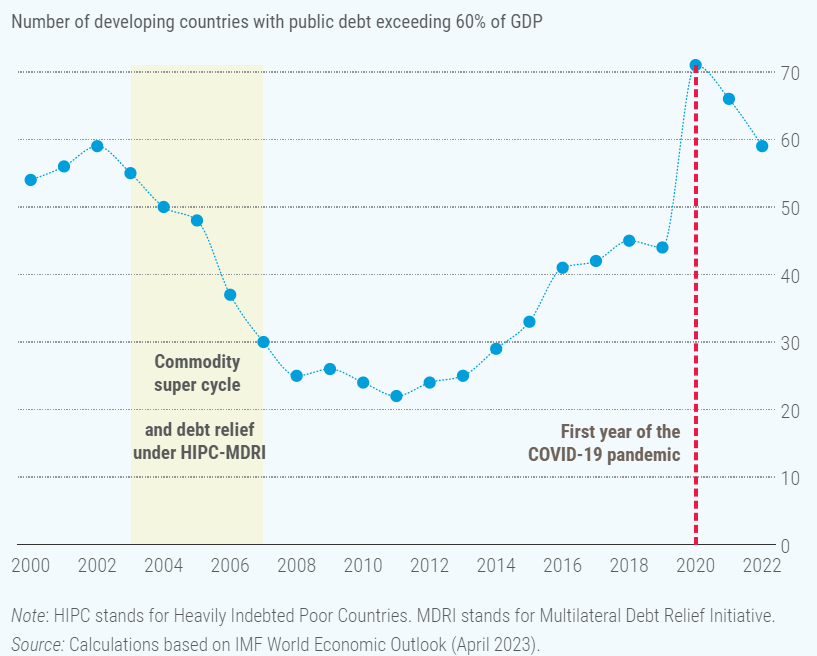
Source: UNCTAD (July, 2023)
From the list of countries eligible for the Poverty Reduction and Growth Trust (PRGT)[1], Republic of Congo, Ghana, Grenada, Lao P.D.R., Malawi, Sao Tome, Somalia, Sudan, Zambia and Zimbabwe are already in high debt distress (IMF, November 30, 2023). Egypt and Pakistan are facing difficulties whilst some nations have already fallen into trouble and defaulted. In the past three years alone, there have been 18 sovereign defaults in 10 developing countries; most recently, Lebanon, Sri Lanka, Suriname, Ghana and Zambia[2]— greater than the number recorded in the previous two decades.
In light of this, the obvious question is whether we are entering another lost decade. Chuku et al. (2023) assess the current situation in LICs, HIPCs, and today’s debt-distressed countries, then compare it with the situation on the eve of the HIPC initiative. Solvency and liquidity indicators show significant improvement since the mid-1990s (see Table 1). Debt levels as a percentage of GDP are lower now for debt-distressed countries than before the HIPC initiative. The median public debt-to-GDP ratio decreased from 72% in 1994 to 66% in 2021, while the public and publicly guaranteed external debt-to-GDP ratio dropped from 72% to 39% (Chuku et al., 2023). Presently, countries spend less on external debt service, with median expenditure at 9% of revenues and 18% of export earnings, below the most restrictive thresholds of 11% and 20% respectively (Chuku et al., 2023). Similar improvements are noted for HIPCs and LICs (see Table 1).
Table 1: Comparison of Median Debt Burden Indicators, 2021 versus 1994
| Group | Year | Total debt as % of GDP | External debt as % of: | External debt service as % of: | ||
| GDP | Exports | GDP | Exports | |||
| All LICs | 1994 | 72 | 71 | 318 | 10 | 18 |
| 2021 | 53 | 33 | 137 | 8 | 10 | |
| HIPCs | 1994 | 89 | 101 | 466 | 16 | 31 |
| 2021 | 53 | 29 | 155 | 8 | 16 | |
| Today’s high-risk countries | 1994 | 72 | 72 | 366 | 11 | 20 |
| 2021 | 66 | 39 | 163 | 9 | 18 | |
Source: Chuku et al. (2023, p. 15)
If external debt-service-to-revenue ratios continue increasing at the observed rate of one percentage point per year for median LICs, or two percentage points for those in distress, pre-HIPC era liquidity burdens may return within 7 to 10 years. Chuku et al. (2023) find lower default risk in LICs compared to decades ago, yet current struggles with debt payment persist. IMF-mandated austerity measures have forced LICs to cut critical public investment and social spending (Kentikelenis & Stubbs, 2023), resulting in declining real wages, slow economic growth, and limited macroeconomic flexibility, jeopardizing short-term recovery and long-term development (see Figure 5). This is exacerbated by the vulnerability of LICs to external economic shocks, essentially when it comes to (critical) commodity price volatility on the one hand, and on the other hand currency depreciation (Kharas, April, 2020). Thus, depending on the continent, debt (management) seems to have an impact on several sectors. Interest payments in Africa surpass spending on education and health (UNCTAD, July 2023). Developing countries in Asia and Oceania (excluding China) are also allocating more funds to interest payments than to health (UNCTAD, July, 2023). According to the UNCTAD (July, 2023), the same is true in Latin America and the Caribbean, where more money is channelled into interest payments than into investment. Across the world, rising debt burdens are keeping countries from investing in sustainable development. Fischer and Storm (2023) describe this situation as a “slow burn”.
Figure 5: Public expenditure on net interest, education, health and investment as a share of GDP (%) (2019-2021)
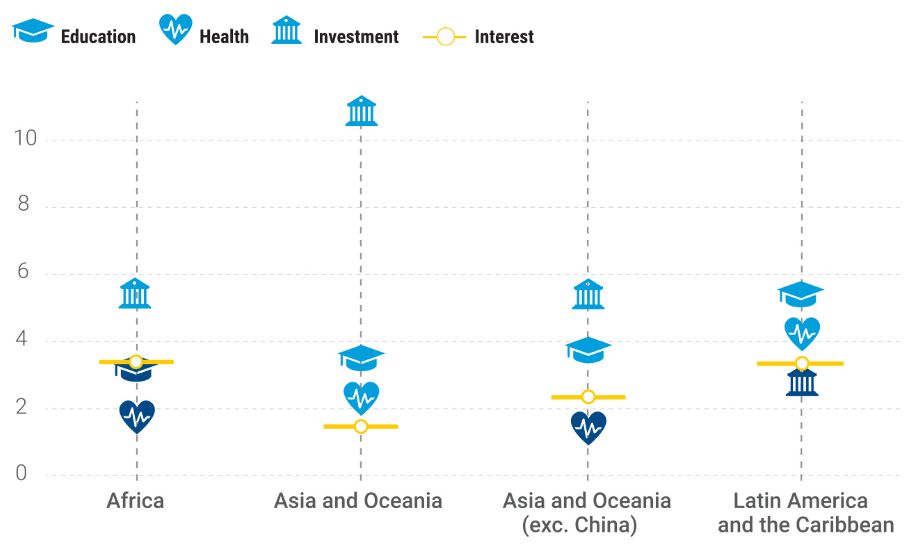
Source: UNCTAD (July, 2023)
This means that behind each of the debts paid by LICs, we have lower expenditure for social needs and respectively less-educated children, more sick people without medical assistance, less finance for climate change adaptation and resilience solutions—or, in other words, less prospects for a better future. Before talking about potential solutions, it is necessary to understand the causes behind this crisis. Unsurprisingly, the experts disagree on the root causes, and their views on the best course of action to tackle this crisis diverge as well. The next section offers an overview on both orthodox and heterodox views on the causes and solutions.
[1] PRGT is the IMF’s main vehicle for providing concessional financing (currently at zero interest rates) to low-income countries (LICs) (IMF, n.d.b).
[2] Russia’s default in 2022 should be considered a technical one. Russia failed to pay due to sanctions imposed on them, not because of lack of funds (Hawser, July 7, 2023).
Navigating the Current Debt Crisis: Insights from Orthodox and Heterodox Perspectives
Both the orthodox and heterodox economic perspectives identify the immediate cause of the current crisis as being the policy of monetary tightening. This involves a strong dollar and increased interest rate in the Global North, and particularly the USA, as a response to post-crisis inflation. The policy led to increased borrowing costs for developing countries. Notably, 23% of emerging and developing countries now face borrowing costs over 10 percentage points higher than the US, a stark increase from just 5% in 2019 (Fleming & McDougall, November 7, 2023). Consequently, debt interest payments, which have reached their highest level since 2010 (see figure 6), strain government revenues. While larger emerging economies cope relatively well, smaller nations with fragile finances struggle, leading to defaults in some cases. Reduced international financing and decreased bond issuance in emerging markets worsen the situation, with investors favoring the US for de-risking. In 2022, new foreign loans to emerging market sovereigns hit a decade low, and private creditors received $185 billion more in repayments than they disbursed, marking the first such occurrence since 2015 (McDougall, December 13, 2023).
Figure 6: Interest costs trend
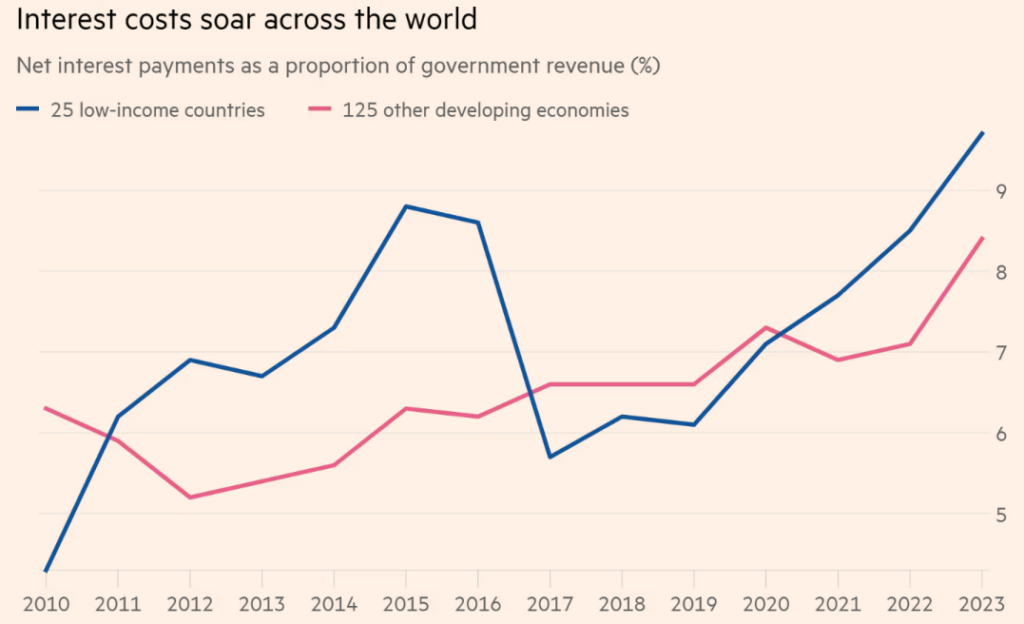
Source: Fleming & McDougall (November 7, 2023)
However, compared to the orthodox view, which considers monetary tightening in the Global North a positive response to the current situation, the heterodox perspective considers such a policy harmful for both developed and developing economies (Fischer & Storm, 2023). For instance, Storm (2023) demonstrates that the globally increased inflation trend is not driven by a higher level of demand—a context in which case monetary tightening would make sense. Instead, it is supply-driven through disruption of supply chains, higher global commodity prices, and supply-bottlenecks in the USA itself due to a decline in the USA labor force, inefficiency of US ports, and a shortage of long-haul truck drivers (LastWeekTonight, April 2, 2022). Storm (2023) proposes strategic price controls, elimination of commodity-market speculations, and measures to remove domestic supply-side bottlenecks and shield vulnerable households and firms from the negative impacts of high inflation as better measures to tackle the current crisis, and with far fewer negative repercussions on the developing countries.
Another immediate cause that we already referred to is the debt burden accumulated during the COVID pandemics and the spikes of food and energy prices provoked by the war in Ukraine. Coupled with the increased cost of borrowing, the accumulated pile of debt put many small emerging economies into difficulties. Some voices warned about this crisis and called for not blaming COVID (Estevao & Essl, June 28, 2022). Estevao and Essl (June 28, 2022) argue that the crisis’s roots predate the pandemic. Public debt has surged in LICs over the last decade, facilitated by initiatives like HIPC and MDRI1. The main problem with this debt is that it has been spent on covering current consumption (e.g. bills for public workers), or worse, accumulation of private assets stored abroad, and not used for capital investment such as building the roads, schools and factories which would bring benefits in the future (Estevao & Essl, June 28, 2022; Essl et al., 2019). For instance, Gambian government debt increased from nearly 60% of GDP in 2013 to an estimated 88% in 2017, with interest payments absorbing 42% of revenue. This rise is attributed to loose fiscal policy, bailouts of state-owned enterprises, and widespread mismanagement (Essl et al., 2019).
Furthermore, the orthodox lens considers that the rise of China and commercial creditors as major lenders to developing countries has exacerbated the current crisis. Between 2000 and 2021, the share of public and publicly guaranteed external debt owed to bondholders surged from 10% to 50%, while China’s share increased from 1% to 15%, contrasting with a decline in the Paris Club’s share from 55% to 18% (Wolf, January 17, 2013) (See Figure 7). China’s emergence as an international lender of last resort, accounting for over 20% of total IMF lending in the past decade, has seen bailouts grow rapidly but with opaque terms and relatively high interest rates, adding to debt burdens (Horn et al., 2023a). However, China’s lending boom has contracted, leading to a rise in debt distress and defaults across the developing world (Horn et al., 2023b). Once again, the heterodox economists [LF1] [DT2] agree that the turn towards private creditors who are currently de-risking the USA, and China’s shrinking lending boom has exacerbated the current crisis. Nevertheless, they remind us that this shift has been largely supported by the IMF and WB through policies of financial liberalization and those which promote the issuance of bonds by the developing countries (Fischer & Storm, 2023).
Figure 7: External public debt of Low-Income Countries by creditor ($bn)
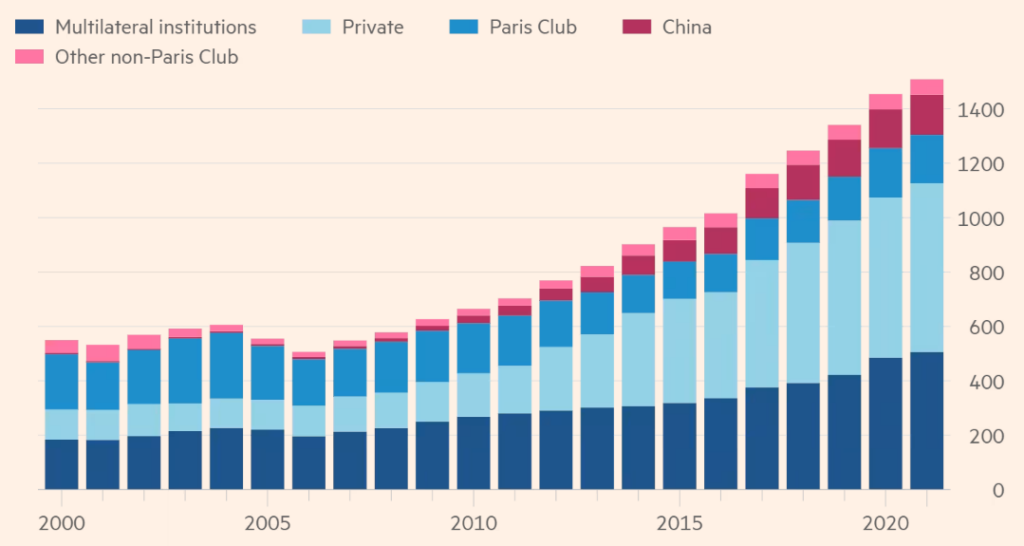
Source: Wolf (January 17, 2013)
Before we proceed further, we will briefly discuss the two main issues with these new creditors. The first is that lending arrangements for commercial and non-Paris Club debt are more expensive than debt owed to multi-lateral institutions and Paris Club bilateral debt. Despite holding 26.5% of LICs’ debt, the private sector accounts for 37% of debt service due to their higher costs (see figure 8) (Coulibaly & Abedin, 2023).
Figure 8: Share of debt versus share of debt service cost in 2021

Source: Coulibaly & Abedin (2023, p. 4).
The second issue refers to coordination challenges, especially with collateralized debt, which is further exacerbated by the lack of an effective framework for restructuring (Cassimon & Mavrotas, 2023). Unlike in the HIPCs era, currently there is no effective framework for coordinating creditors or restructuring debt (Essers & Cassimon, 2022; Wolf, January 17, 2013). A potential framework could serve the Debt Service Suspension Initiative (DSSI) and the Common Framework for Debt Treatments beyond the DSSI, launched by the G20 in response to COVID-19’s economic impact. However, the DSSI primarily involves the Paris Club, with larger creditors often disengaged (Wolf, January 17, 2013). Only three countries sought debt restructuring under the G20 Common Framework, with China participating in negotiations, yet broader creditor engagement remains lacking (Ramadane, November 11, 2022; The African Sovereign Debt Justice Network, June 25, 2023). The IMF admits the insufficiency of restructuring approaches (Wolf, January 17, 2013). Despite potential benefits, debtor countries show limited enthusiasm, with only 23% of external debt repayments postponed (Essers & Cassimon, 2022). Their reluctance stems from potential reputational harm and uncertainty about costs and benefits (Cassimon et al., 2023; Essers & Cassimon, 2022), highlighting the need for comprehensive and effective debt relief mechanisms.
Compared to the orthodox views, the heterodox perspective digs deeper into the causes of the current crisis by questioning the inequalities in the international financial architecture. The UNCTAD (July 2023) underline that developing countries are more exposed to external shocks because they borrow in foreign currencies. For instance, if a country’s currency devalues, their debt payments in foreign currency can skyrocket. At the same time, when financial conditions change or international investors become more risk averse, borrowing costs suddenly increase for developing countries. Developing countries also pay much higher interest rates than advanced economies. Countries in Africa borrow at rates that are on average four times higher than those of the USA and eight times higher than those of Germany (see figure 9) (UNCTAD, July, 2023). High borrowing costs make it difficult for developing countries to fund important investments, which in turn further undermines debt sustainability and progress towards sustainable development.
Figure 9: Bond yields for developed and developing countries
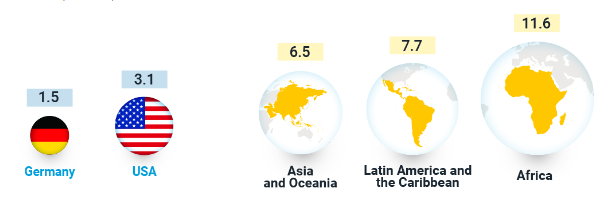
Source: UNCTAD (July, 2023)
Given this, proponents of the heterodox approach advocate for reforming international financing mechanisms to enable developing countries to access funds at affordable rates, facilitating essential expenditures for development and sustainability.
Whether orthodox or heterodox, the debt crisis and its (latent) adverse consequences (analyzed above) in developing countries require several analytical approaches, and as many commentators agree, several development strategies are worth considering. Faced with these obstacles to the sustainable development of developing countries, it is all the more necessary to carry out a comprehensive analysis of the debt sustainability of these countries and, overall, to make a prudent diagnosis of debt management strategies. Indeed, to be prudent, this diagnosis must incorporate ways of negotiating debt restructuring agreements that take into account the need to reduce debt servicing costs, while at the same time putting in place initiatives within developing countries (or, more generally, countries in financial distress) to reduce overall debt levels.
In this painstaking process, the role of government policies in strengthening financial regulations and continuously assessing (and/or mitigating) the risks associated with excessive borrowing must be taken into account. An upstream strategy would be to suggest that, while for many developing countries commodities determine the economic fabric of countries and therefore the sources of revenue for debt repayment (a typical case of this would be the DR Congo, for example), it is important to promote a less extroverted and more diversified economy that is not dependent to a large extent on the volatility of commodity prices on the world market.
Conclusion
The evolution of public debt and its current situation is one of the major challenges facing many countries in the era of globalization. At a time when global debt has been rising exponentially for just over half a century, the least developed countries (compared with the most advanced) remain trapped in a cycle of payment difficulties amid the emergence of a country like China, which is increasingly asserting itself as a major player in the global debt landscape. This is happening against a backdrop of growing (and constantly threatening) global problems such as the climate crisis, and geopolitical (e.g. war in Ukraine), economic (e.g. 2008 financial crisis) and health risks (e.g. Covid-19) of various kinds. The vulnerability of low-income countries to default (or debt management) is a cause for concern, given the dependence of many of these countries on the volatility of commodity prices, in addition to the currency depreciations that can occur in these countries. As a result, this can slow down growth while reducing real wages, and more generally compromise long-term development. This is why, when questioning the root causes of the debt crisis, whether from the perspective of orthodox or heterodox arguments, we need to think about more robust measures of financial regulation that ensure an ongoing assessment and mitigation of the risks associated with indebtedness.
References
- African Sovereign Debt Justice Network (June 25, 2023). Eighty Eighth Sovereign Debt News Update: Zambia Seals $6.3 billion Debt Restructuring Deal that Excludes Private Creditors. Afronimicslaw. https://www.afronomicslaw.org/category/african-sovereign-debt-justice-network-afsdjn/eighty-eighth-sovereign-debt-news-update
- Bahceli, Y., Ranasinghe, D., & Martinez, M. (2023, September 16). As global debt worries mount, is another crisis brewing? Reuters. https://www.reuters.com/markets/global-debt-worries-mount-is-another-crisis-brewing-2023-10-16/
- Campos, R. (2023, September, 19). Global debt hits record $307 trillion, debt ratios climb -IIF. Reuters. https://www.reuters.com/markets/global-debt-hits-record-307-trillion-debt-ratios-climb-iif-2023-09-19/
- Casimon, D., & Mavrotas, G. (2023). Public debt vulnerabilities in LICs: current status and proposed solutions. Development Finance Agenda, 8, 6-8.
- Chuku, C., Prateek, S., Saito, J., Hakura, D., Chamon, M., Cerisola, M. D., Chabert, G., Zettelmeyer, J. (2023). Are We Heading for Another Debt Crisis in Low-Income Countries? Debt Vulnerabilities: Today vs the Pre-HIPC Era. IMF Working Paper No. 2023/079. http://dx.doi.org/10.5089/9798400239939.001
- Coulibaly, B. S., & Abedin, W. (2023). Addressing the looming sovereign debt crisis in the developing world: it is time to consider a ‘Brady Plan’. Global Economy and Development at Brookings. Policy Brief. https://www.brookings.edu/wp-content/uploads/2023/04/Coulibaly-Abedin-2023.pdf
- Easterly, W. (2001). The elusive quest for Growth: Economists’ adventures and misadventures in the tropics. The MIT Press.
- Essers, D., & Cassimon, D. (2022). Towards HIPC 2.0 ? Lessons from past debt relief initiatives for addressing current debt problems. Journal of globalization and development. ISSN 1948-1837-13:2 (2022), p. 187-231. https://doi.org/10.1515/JGD-2021-0051
- Essl, S., Celik, S. K., Kirby, P., & Proite, A. (2019). Debt in Low-Income Countries. Evolution, Implications, and Remedies. World Bank, Policy Research Working Paper 8794. https://documents1.worldbank.org/curated/en/378031553539256399/pdf/Debt-in-Low-Income-Countries-Evolution-Implications-and-Remedies.pdf
- Estevao, M., & Essl, S. (2022, June 28). When the debt crises hit, don’t simply blame the pandemic. World Bank Blog. https://blogs.worldbank.org/voices/when-debt-crises-hit-dont-simply-blame-pandemic
- Fischer, A. M., & Storm, S. (2023). The Return of Debt Crisis in Developing Countries: Shifting or Maintaining Dominant Development Paradigms? Development and Change, 54(5), 954-993. https://doi.org/10.1111/dech.12800
- Fleming, S., & McDougall, M. (2023, November 7). US interest rates add to ‘silent debt crisis’ in developing countries. Financial Times. https://www.ft.com/content/b8a9fd5d-868c-41c8-b03c-e9c0cc01aecd
- Gaspar, V., Poplawski-Ribeiro, M., & Yoo, J. (2023, September, 13). Global Debt Is Returning to its Rising Trend. IMF Blog. https://www.imf.org/en/Blogs/Articles/2023/09/13/global-debt-is-returning-to-its-rising-trend
- Hawser, A. (2023, July 7).Unbowed By Sanctions, Russia Claims No-Fault Default. Global Finance. https://gfmag.com/news/russian-economy-perseveres-despite-sanctions-and-default/
- Horn, S., Parks, B. C., Reinhart, C. M., & Trebesch, C. (2023a). China as an International Lender of Last Resort. National Bureau of Economic Research, working paper 31105. DOI: 10.3386/w31105 http://www.nber.org/papers/w31105
- Horn, S., Parks, B. C., Reinhart, C. M., & Trebesch, C. (2023b). Debt Distress on China’s Belt and Road. AEA Papers and Proceedings, 113, 131-34. DOI: 10.1257/pandp.20231004
- IMF (n.d.a.). Global Debt Database. IMF. https://www.imf.org/external/datamapper/datasets/GDD
- IMF (n.d.b). What’s the PRGT? IMF. https://www.imf.org/en/Topics/PRGT
- IMF (2023). Global Debt Monitor. IMF, Fiscal Affairs Department.
- IMF (2023, November 30). List of LIC DSAa for PRGT-Eligible Countries. IMF. https://www.imf.org/external/pubs/ft/dsa/dsalist.pdf
- Kharas, A. (April 13, 2020). What to do about the current debt crisis in developing crisis? Brookings. https://www.brookings.edu/articles/what-to-do-about-the-coming-debt-crisis-in-developing-countries/
- Kentikelenis, A. & Stubbs, S. (2023). A Thousand Cuts: Protection in the Age of Austerity. Oxford University Press.
- LastWeekTonight (2022, April 2). Trucks. YouTube. https://www.youtube.com/watch?v=phieTCxQRLA
- McDougall, M. (December 13, 2023). Poor countries’ debt costs to hit ‘crisis’ levels, says World Bank. https://www.ft.com/content/7b77b045-8b5b-4249-8fb9-551577559550
- Partington, R. (2022, October 20). The mini-budget that broke Britain – and Liz Truss. The Guardian. https://www.theguardian.com/business/2022/oct/20/the-mini-budget-that-broke-britain-and-liz-truss
- Ramadane, M. (November 11, 2022). Chad agrees debt plan with creditors, including Glencore. Reuters. https://www.reuters.com/world/africa/chad-agrees-debt-plan-with-creditors-including-glencore-says-minister-2022-11-11/
- Rossi, S. & Consiglio, V. (2023, October, 2). Italy hikes 2023 debt issuance as public finances creak. Reuters. https://www.reuters.com/markets/europe/italy-hikes-2023-debt-issuance-public-finances-creak-2023-09-30/
- Storm, S. (2023). Inflation in the Time of Corona and War. Institute for New Economic Thinking Working Paper Series No. 185, Available at SSRN: https://ssrn.com/abstract=4138714
- UNCTAD (July, 2023). A world of Debt. A growing burden to global prosperity. UNCTAD. https://unctad.org/publication/world-of-debt
- Wolf, M. (January 17, 2023). We must tackle the looming global debt crisis before it’s too late. Financial Times. https://www.ft.com/content/889fec5a-cb62-463f-af8c-22c841bddb65
- WB (2023). International Debt Report 2023. World Bank Group. https://www.worldbank.org/en/programs/debt-statistics/idr/products